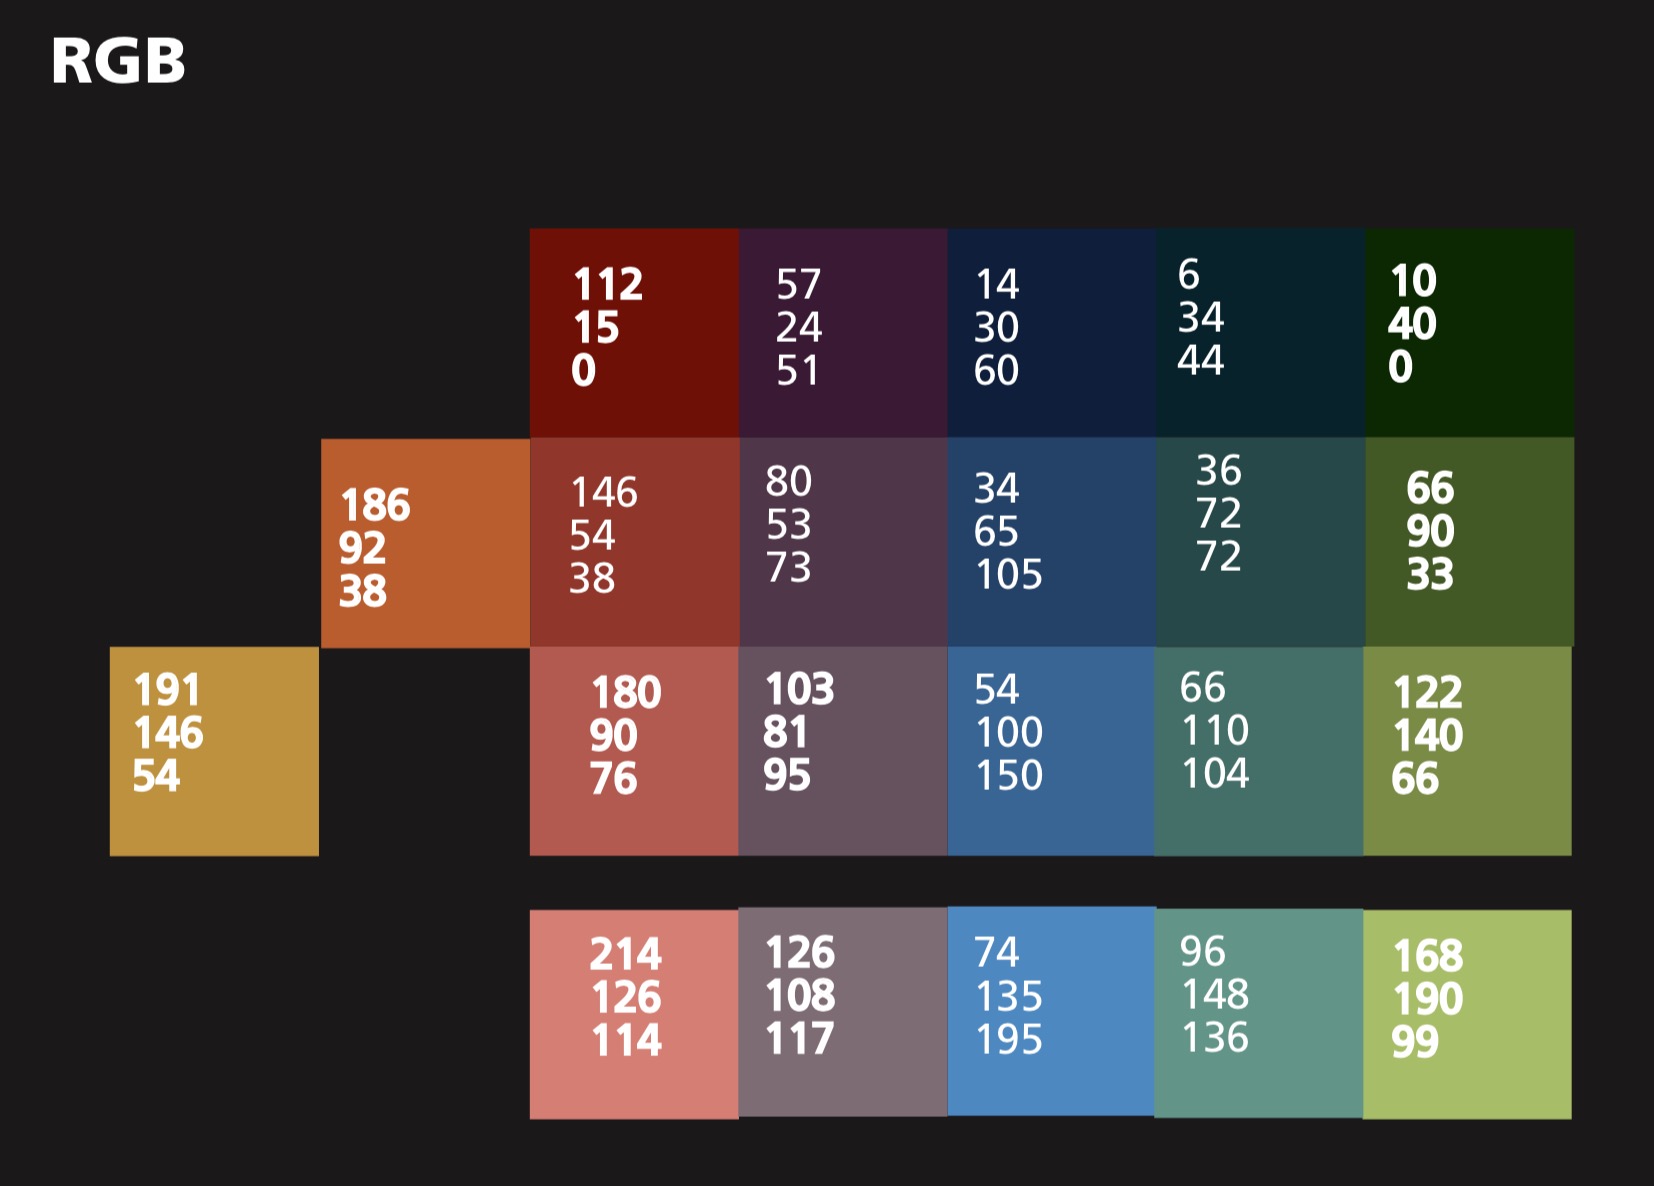
A while back I made a colour scheme for scientific figures out of the opening frames of Rabbit of Seville.

Here is the matlab code, and here it is in the wild, in Banas et al. (2009), “The Columbia River plume as cross-shelf exporter and along-coast barrier” (probably the most complex figure I’ve ever done) …

… and in Banas et al. (2014), “Patterns of River Influence and Connectivity Among Subbasins of Puget Sound, with Application to Bacterial and Nutrient Loading” …


