flowWeaver is an interactive tool for exploring transport and connectivity patterns in high-resolution ocean models such as ROMS. The initial application (version 0.4.3) contains two weeks of Salish Sea and Pacific Northwest coastal circulation during summer 2005. The underlying ocean model is MoSSea (Modeling the Salish Sea).
Pablo Otero has adapted flowWeaver for an operational forecast of the Galician coast as described in this paper.
Future plans include a version that runs in a web browser (based on p5.js), and a general recipe for getting flowWeaver to run with the circulation model of your choice.
Installation
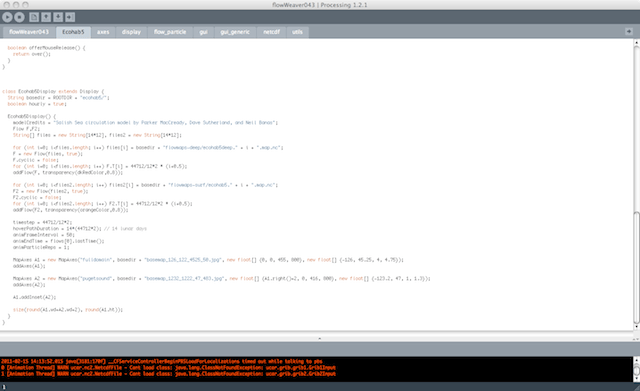
Decompress the .zip file above. This contains a ready-to-go Mac application, which needs to have the “ecohab5” folder in the same directory as it. Alternatively, you can install Processing, open the source code inside it, and run it from there. Just change the “ROOTDIR” variable at the top of the code to point to where the “ecohab5” folder sits.
How it works
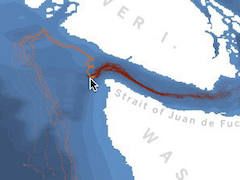
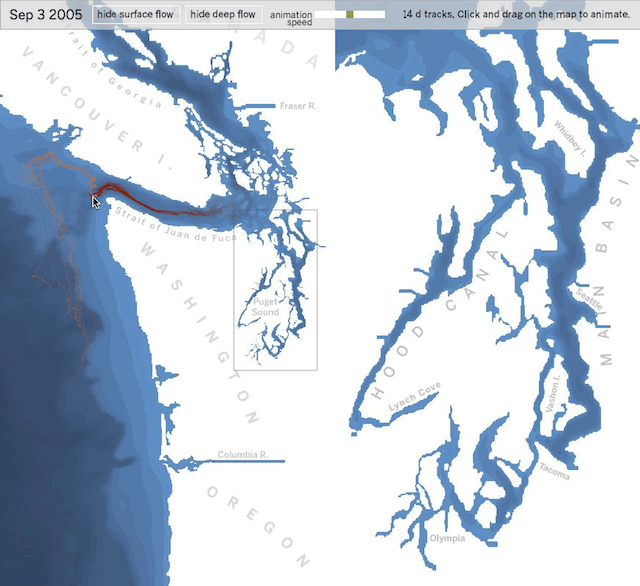
Hover over the map to see the path that water at the surface (orange) and at depth (3/4 of the way to the bottom: red) will take over the next 14 days…
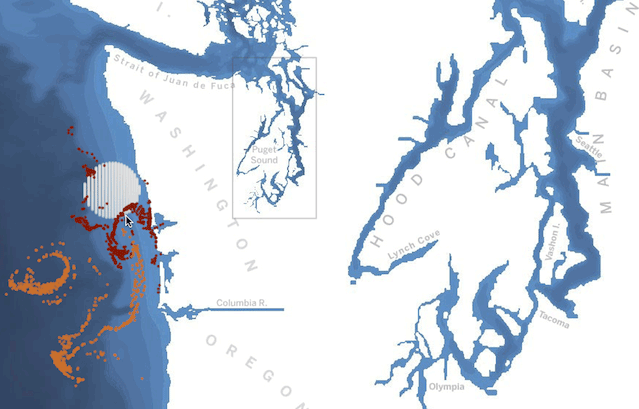
…or click and drag a circle, to see an animation of surface and deep transport.
flowWeaver is written in Java using the Processing toolkit. It relies on an intensive, custom particle-tracking analysis of the underlying ROMS simulation, saved as a series of “flowmap” files, essentially transition matrices that allow the visualizer to update trajectories with high accuracy over an anritrarily long interval with a single lookup. This paper describes a similar method.